Strada Announces Partnership with NiCE CXone Read our blogpost →
Strada Announces Partnership with NiCE CXone
Read our blogpost →
Strada Announces Partnership with NiCE CXone Read our blogpost →
Analytics Resolved: A Powerful Solution for Custom Reporting

Udayan Maurya
Founding Engineer
4 min read
Browser-based SQL for customizable reporting without engineering.
Abstract
Analytics dashboards are a well-known Catch-22 in the B2B SaaS world. Everyone agrees they’re important, yet seldom deemed not important enough to make it to the engineering roadmap.
Despite the visibility and value analytics can offer, they remain too cumbersome to implement. Ultimately, the question becomes: do they justify the engineering investment?
At Strada, we’ve resolved this Catch-22 by enabling SQL execution directly in the browser. This approach drastically reduces the cost of building analytics pages and empowers users to create ad-hoc dashboards on their own!
All important analytics
Analytics is crucial for understanding and improving any business. For B2B SaaS providers, sometimes, it is vital to justify their existence in the customer’s software suite.
Greater visibility into the system’s operational data can turn any user into a power user. Get them hooked, and keep coming back for more. As a result, the feedback loop strengthens and product development becomes more value-driven.
However, implementing analytics dashboards remain challenging for engineering teams…
Analytics is crucial, but…
Building high-quality analytics dashboards comes with several daunting engineering challenges:
1. Filtering data
Before you can display useful analytics, the first step is filtering the right data. In B2B applications, filters can range from simple selectors like you’d find on an e-commerce site:
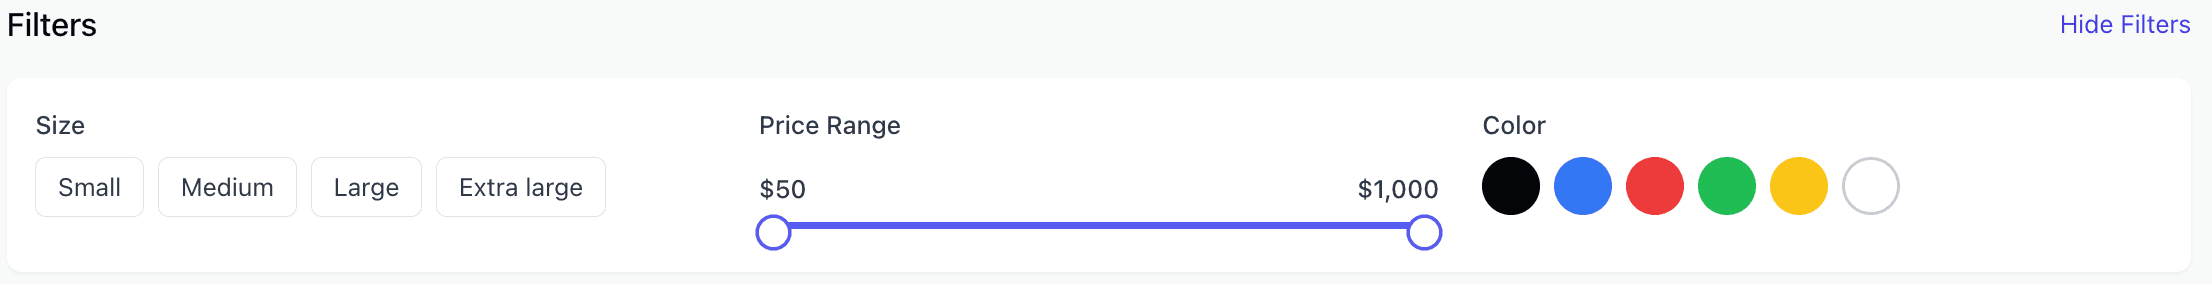
…to highly dynamic configurations, like those in a CRM:

As applications grow, building and maintaining these filters requires significant ongoing engineering effort. And yet, customers still run into frustrations:
“The filters aren’t flexible enough.”
“I can’t drill down to the exact data I need.”
“The filtering system feels too complex to use.”
As a result, the effort to support robust filtering often balloons - adding cost and complexity to analytics dashboards.
2. Aggregating data
Aggregation follows filtering. Basic performance metrics often rely on simple calculations like minimum, maximum, or average. However, in practice, aggregation logic can quickly grow complex - especially when measuring key aspects of business operations.
In the insurance domain, for example, common aggregated metrics include:
Loss Ratio: Claims Paid / Premiums Earned
Renewal Rate: Percentage of policyholders who renew coverage
Premium Growth Rate: ((This Period’s Premium − Last Period’s Premium) / Last Period’s Premium) × 100
Keeping up with the growing demand to track and analyze a wide range of metrics is an ongoing and resource-intensive challenge for engineering teams.
3. Flexibility
Every B2B customer has slightly different requirements and priorities. What one values may not matter to another. Satisfying a wide range of requests using few charts your engineering team can build is a moonshot!
An elegant solution
What if there was a silver bullet that can be used to filter, and aggregate data. Also, it’ll be amazing if it can be exposed to the end user so they can have all the flexibility they want.
Well there is one such silver bullet - SQL
SELECT
  state,
  AVG(premium_amount) AS avg_premium -- Aggregator
FROM
  policies
WHERE
  premium_amount > 500 -- Filter
GROUP BY
  state
SQL is not only powerful and expressive, it’s also widely known. And thanks to modern language models, generating it programmatically has never been easier, making adoption much smoother.
So what is the secret sauce?
Strada is a voice AI provider. Our customers include insurance carriers, MGAs (Managing General Agents), and brokers. They care deeply about measuring the performance of calls made and received by our voice AI agents.
On the analytics page, we:
Fetch calls data using a REST API from our server. The data has information on caller details, call summary, call transcripts, and tools used by the AI agent.
Spin up a Postgres database in the browser using pglite, and insert all the calls data in the database.
Provide a user interface that lets users write SQL queries directly against the in-browser database and visualize the result using charts.

Using our custom analytics builder, customers have created powerful dashboards on their own. Some prominent examples:


Benefits of this approach
A key advantage of this approach is its cost-effectiveness. Once the initial engineering work is done, users can create their own charts without requiring further engineering effort.
Business leaders who deeply understand their own operations, can explore data more directly and ask sharper, more relevant questions. By removing engineering from the chart-building process, this approach creates a more seamless and engaging experience.
As a result, businesses extract more value from your product. They gain clearer visibility into how the product drives outcomes, which in turn strengthens the product development feedback loop.
Carriers, MGAs, and brokers scale revenue-driving phone calls with Strada's conversational AI platform.
Start scaling with voice AI agents today
Join innovative carriers and MGAs transforming their calls with Strada.
Analytics Resolved: A Powerful Solution for Custom Reporting
Udayan Maurya
Founding Engineer
4 min read
Browser-based SQL for customizable reporting without engineering.
Abstract
Analytics dashboards are a well-known Catch-22 in the B2B SaaS world. Everyone agrees they’re important, yet seldom deemed not important enough to make it to the engineering roadmap.
Despite the visibility and value analytics can offer, they remain too cumbersome to implement. Ultimately, the question becomes: do they justify the engineering investment?
At Strada, we’ve resolved this Catch-22 by enabling SQL execution directly in the browser. This approach drastically reduces the cost of building analytics pages and empowers users to create ad-hoc dashboards on their own!
All important analytics
Analytics is crucial for understanding and improving any business. For B2B SaaS providers, sometimes, it is vital to justify their existence in the customer’s software suite.
Greater visibility into the system’s operational data can turn any user into a power user. Get them hooked, and keep coming back for more. As a result, the feedback loop strengthens and product development becomes more value-driven.
However, implementing analytics dashboards remain challenging for engineering teams…
Analytics is crucial, but…
Building high-quality analytics dashboards comes with several daunting engineering challenges:
1. Filtering data
Before you can display useful analytics, the first step is filtering the right data. In B2B applications, filters can range from simple selectors like you’d find on an e-commerce site:
…to highly dynamic configurations, like those in a CRM:
As applications grow, building and maintaining these filters requires significant ongoing engineering effort. And yet, customers still run into frustrations:
“The filters aren’t flexible enough.”
“I can’t drill down to the exact data I need.”
“The filtering system feels too complex to use.”
As a result, the effort to support robust filtering often balloons - adding cost and complexity to analytics dashboards.
2. Aggregating data
Aggregation follows filtering. Basic performance metrics often rely on simple calculations like minimum, maximum, or average. However, in practice, aggregation logic can quickly grow complex - especially when measuring key aspects of business operations.
In the insurance domain, for example, common aggregated metrics include:
Loss Ratio: Claims Paid / Premiums Earned
Renewal Rate: Percentage of policyholders who renew coverage
Premium Growth Rate: ((This Period’s Premium − Last Period’s Premium) / Last Period’s Premium) × 100
Keeping up with the growing demand to track and analyze a wide range of metrics is an ongoing and resource-intensive challenge for engineering teams.
3. Flexibility
Every B2B customer has slightly different requirements and priorities. What one values may not matter to another. Satisfying a wide range of requests using few charts your engineering team can build is a moonshot!
An elegant solution
What if there was a silver bullet that can be used to filter, and aggregate data. Also, it’ll be amazing if it can be exposed to the end user so they can have all the flexibility they want.
Well there is one such silver bullet - SQL
SELECT
  state,
  AVG(premium_amount) AS avg_premium -- Aggregator
FROM
  policies
WHERE
  premium_amount > 500 -- Filter
GROUP BY
  state
SQL is not only powerful and expressive, it’s also widely known. And thanks to modern language models, generating it programmatically has never been easier, making adoption much smoother.
So what is the secret sauce?
Strada is a voice AI provider. Our customers include insurance carriers, MGAs (Managing General Agents), and brokers. They care deeply about measuring the performance of calls made and received by our voice AI agents.
On the analytics page, we:
Fetch calls data using a REST API from our server. The data has information on caller details, call summary, call transcripts, and tools used by the AI agent.
Spin up a Postgres database in the browser using pglite, and insert all the calls data in the database.
Provide a user interface that lets users write SQL queries directly against the in-browser database and visualize the result using charts.
Using our custom analytics builder, customers have created powerful dashboards on their own. Some prominent examples:
Benefits of this approach
A key advantage of this approach is its cost-effectiveness. Once the initial engineering work is done, users can create their own charts without requiring further engineering effort.
Business leaders who deeply understand their own operations, can explore data more directly and ask sharper, more relevant questions. By removing engineering from the chart-building process, this approach creates a more seamless and engaging experience.
As a result, businesses extract more value from your product. They gain clearer visibility into how the product drives outcomes, which in turn strengthens the product development feedback loop.
Carriers, MGAs, and brokers scale revenue-driving phone calls with Strada's conversational AI platform.
Start scaling with voice AI agents today
Join innovative carriers and MGAs transforming their calls with Strada.

Agentic AI for insurance operations
© 2026 Strada API, Inc.
Agentic AI for insurance operations
© 2026 Strada API, Inc.
Agentic AI for insurance operations
© 2026 Strada API, Inc.